Let's discuss reverse engineering tools. With all the disassemblers and debuggers we have at our disposal, we can readily dissect an interesting part of an executable. What our tools are less good at, however, is locating these parts.
We often try to find some trick to latch onto the interesting subroutines of the target. Common techniques include searching for strings or looking for interesting imports/exports. In the absence of such hints, a long and tedious walk through the call graph awaits us; we're ill-equipped against pure code. This inspired me to experiment with visualization.
How to visualize memory accesses?
- I visualized memory accesses on a 2D grid s. t.
- X-axis represents an accessed memory location
- Y-axis represents time and increases downward
- red = write accesses, green = read accesses, yellow = both
Without further ado, let's check out some actual visualizations.
Victim 1: pngcheck
Our first victim is the pngcheck utility from the libpng open source library.
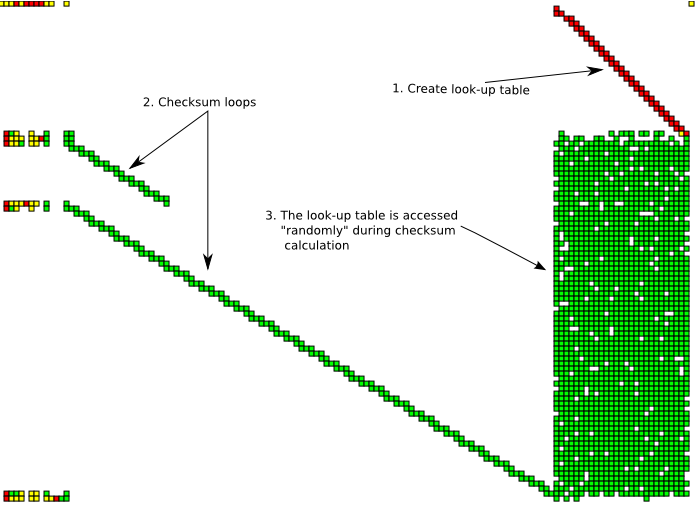
Reading the graph from top to down there's a write loop (red diagonal line in the top-right corner). After this there are two read loops (diagonal green lines). Simultaneously with the read loops, there are random-looking accesses to the areas written during the first write loop.
Closer inspection shows that the write loop is generating a CRC32 look-up table and the read loops are checksumming file contents using this look-up table. The actual read from the file is not visible as the file is read to the buffer from kernel mode, which my user-mode tool is not aware of. This checksumming behavior is consistent with the fact that pngcheck verifies the integrity of png chunk checksums.
Good ol' printf
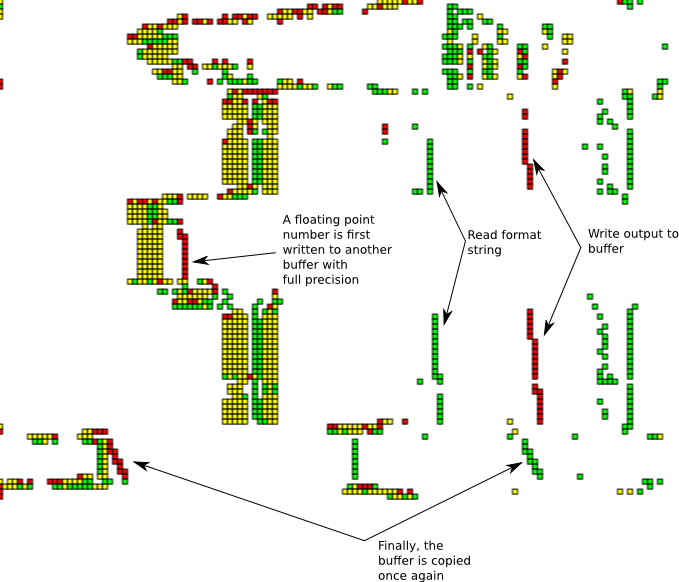
This execution trace of the C library printf function can be seen reading the format string and writing the result to a temporary buffer, and finally reading the contents of this buffer. Note how the stack memory accesses shift left when entering a subroutine that converts the floating point number. This is due to the fact that the stack grows towards smaller ESP values.
Next up: a custom VM - T2 '06 challenge
Our final example is the T2 reverse engineering challenge from 2006. The binary was an emulator for a custom virtual machine that ran self-modifying code. Here the memory access patterns are very revealing, and graphing the T2 binary after initialization gives us the graph below.
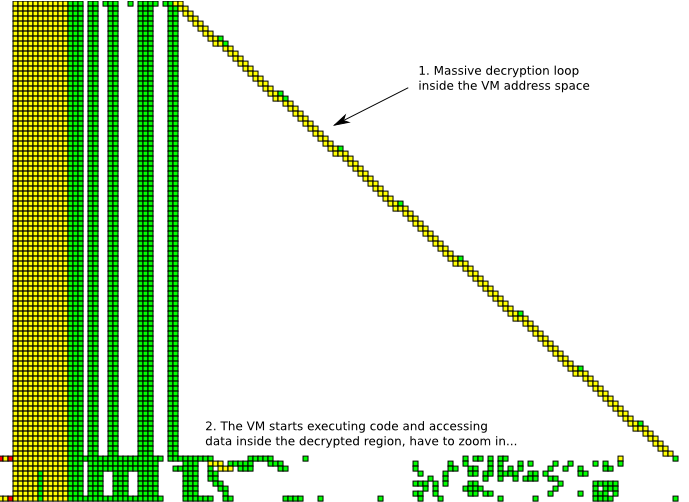
It is immediately obvious that the program spends most of its execution time in a read-write loop, whereafter the memory access pattern changes drastically. This is a tell-tale sign of a packer/protector. The bulk of the decryption loop obscures the most interesting part of the trace, so we'll zoom into lower part of the image to gain a more detailed understanding of what happens after unpacking.
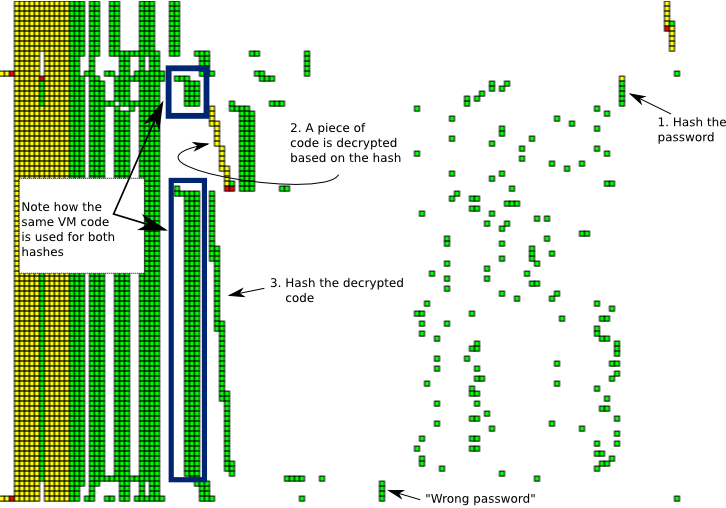
Here I've marked some interesting activities performed during the VM execution. Obviously it is not possible to deduce all this solely based on the visualization. Still, I believe visualizations like these could aid greatly in quickly identifying interesting instructions and memory locations.
Src, plz?
To tinker with the code and try graphing different executables, you can get the code from https://bitbucket.org/oebeling/tracectory/ (GPL license). I have put together a GUI for the tool you can use to zoom around in the time-memory space, but this is far from a ready point-and-click solution.
- As an obligatory caveat emptor, limitations include
- data capture is currently user-mode only (based on OllyDbg run trace)
- not tested with traces larger than ~7M instructions
- cannot analyze all instructions
- no self-modifying code support at the moment